Spending, Revenue, Debt

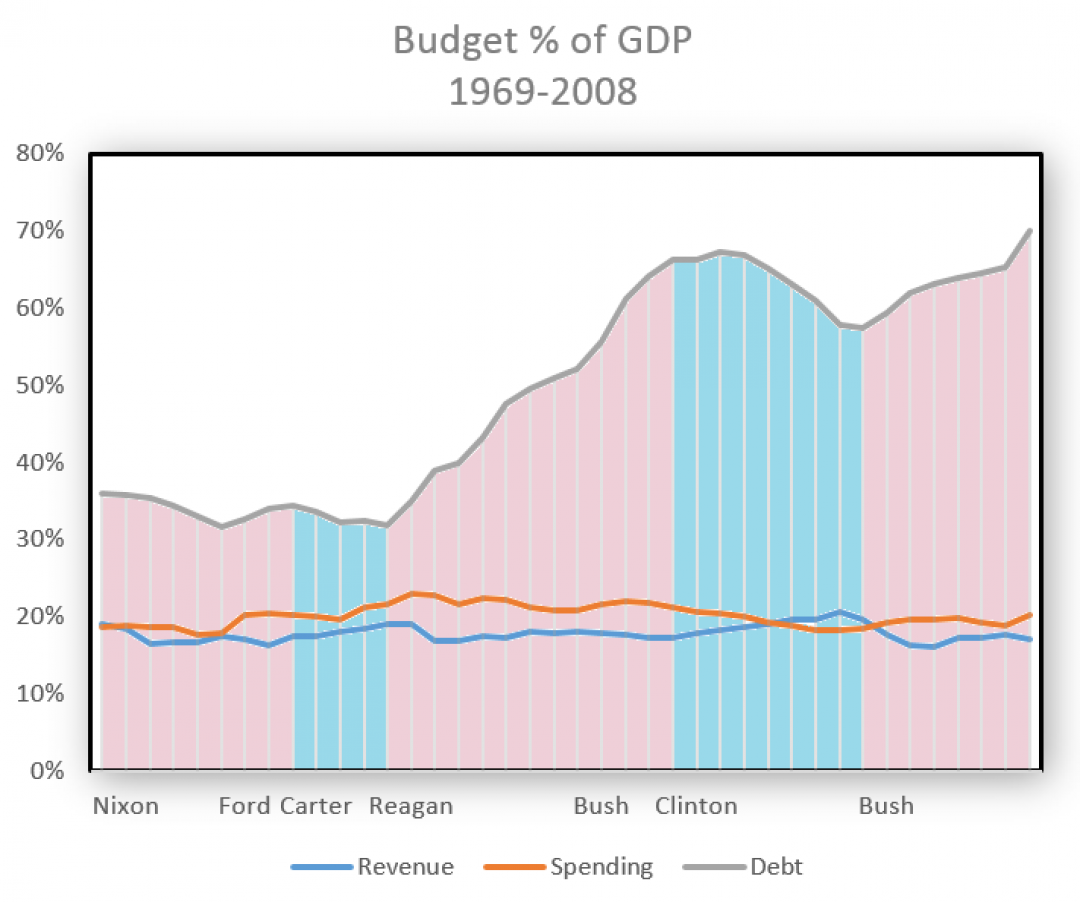
The graph of federal spending, revenue, and debt relative to GDP is one that everyone should understand before talking about government finances. I highlight the years 1969 to 2008 because significant changes happened around then. Graphing back to WWII would show spending and revenue averaging 17.7% and the debt going down the whole time. The big question is “What happened?”
The graph makes it abundantly clear that things made a drastic turn for the worse during the Reagan years, recovered under Clinton, and then made another turn for the worse under George W Bush. The most significant things that happened during these presidencies has to do with taxes. Reagan significantly cut taxes when he first came into office. Clinton increased taxes when he first got in. Bush cut taxes again. The effects are very clear.
I find it very strange that conservatives hold Reagan in such high regard because his presidency was a financial disaster. Back then, I remember the narrative being that by cutting taxes on the wealthy in particular, they would have more money to create more jobs that results in more revenue. Another theory was that if you cut the funds of government, it would force them to cut back on spending. We can see that did not happen.
Reagan was battling a major recessions very comparable to the Great Recession that Obama had to deal with. Both presidents came into office with unemployment over 7% and saw it climb to over 10%. The common formula for recovering from recession is cutting taxes and increasing spending. Revenue dropped to 17% and spending went up to 23%. The problem is that very little was done to repay the debt. Spending went up during the Great Depression and WWII but taxes were increased to pay it back. That is why the debt got under control afterwards.
Clinton increased taxes when he first got into office. That was critical to him achieving a balanced budget. That alone was not enough though. Spending is the other side of the equation. Clinton had the benefit of the Cold War ending and a good economy. The Cold War ended in 1991. Spending (primarily defense spending) constantly went down from that point until the Bush years. Between the tax increases and spending cuts, Clinton got a balanced budget. Spending was at 18% and revenue at 21% in Clinton’s last year.
The Bush years are interesting because he came in with a balanced budget and good economy. In addition, his party controlled the House and Senate his first six years. Clinton only had his party in control of both chambers his first two years. Reagan’s party never had full control. This provides ammunition for both political parties to get credit or blame.
The “Bush Tax Cuts” happen soon after he took office. Considering that Bush was fighting two major wars, his spending really didn’t increase much. His spending was under 20% all but his last year. Had revenue stayed at Clinton’s 21%, Bush would have had balanced budgets his whole term. Unfortunately the tax cuts resulted in revenue dropping to 16%. This lead to a large increase in the debt. It wasn’t until 2013 that Obama was able to get part of that tax cut removed.
If you want to dig into the numbers yourself, I recommend the web site www.USGovernmentSpending.com